CONCEPTO / CONCEPT mar-16 mar
Anuncio
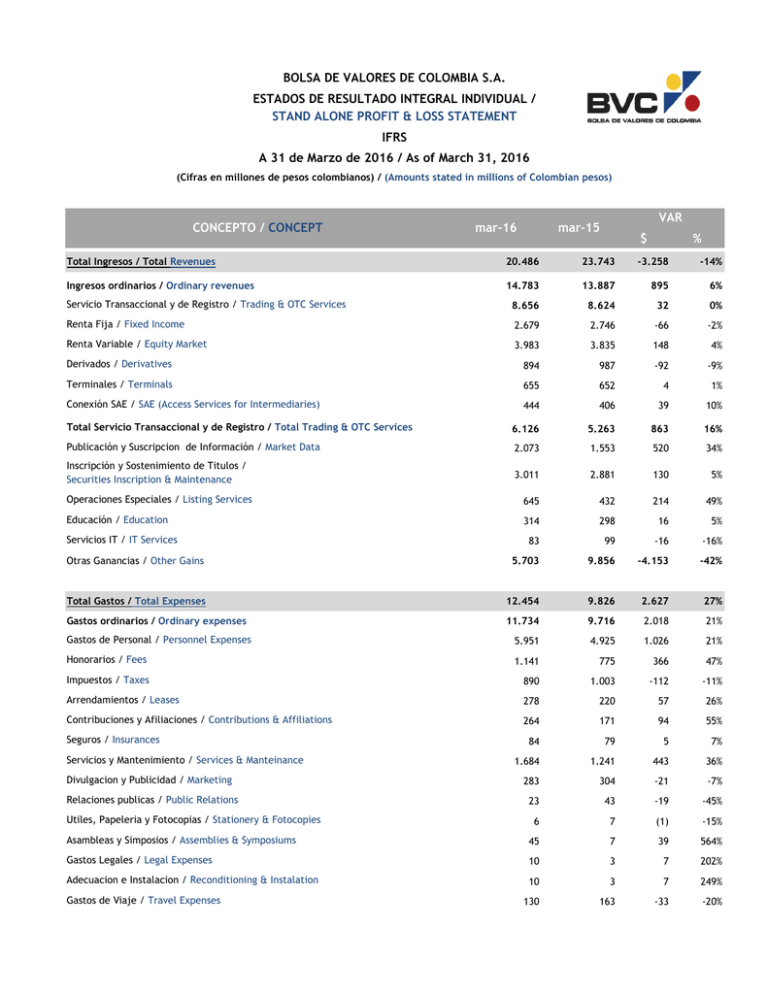
BOLSA DE VALORES DE COLOMBIA S.A. ESTADOS DE RESULTADO INTEGRAL INDIVIDUAL / STAND ALONE PROFIT & LOSS STATEMENT IFRS A 31 de Marzo de 2016 / As of March 31, 2016 (Cifras en millones de pesos colombianos) / (Amounts stated in millions of Colombian pesos) CONCEPTO / CONCEPT mar-16 VAR mar-15 $ % Total Ingresos / Total Revenues 20.486 23.743 -3.258 -14% Ingresos ordinarios / Ordinary revenues 14.783 13.887 895 6% Servicio Transaccional y de Registro / Trading & OTC Services 8.656 8.624 32 0% Renta Fija / Fixed Income 2.679 2.746 -66 -2% Renta Variable / Equity Market 3.983 3.835 148 4% Derivados / Derivatives 894 987 -92 -9% Terminales / Terminals 655 652 4 1% Conexión SAE / SAE (Access Services for Intermediaries) 444 406 39 10% Total Servicio Transaccional y de Registro / Total Trading & OTC Services 6.126 5.263 863 16% Publicación y Suscripcion de Información / Market Data 2.073 1.553 520 34% Inscripción y Sostenimiento de Titulos / Securities Inscription & Maintenance 3.011 2.881 130 5% Operaciones Especiales / Listing Services 645 432 214 49% Educación / Education 314 298 16 5% 83 99 -16 -16% Otras Ganancias / Other Gains 5.703 9.856 -4.153 -42% Total Gastos / Total Expenses 12.454 9.826 2.627 27% Gastos ordinarios / Ordinary expenses 11.734 9.716 2.018 21% Gastos de Personal / Personnel Expenses 5.951 4.925 1.026 21% Honorarios / Fees 1.141 775 366 47% Impuestos / Taxes 890 1.003 -112 -11% Arrendamientos / Leases 278 220 57 26% Contribuciones y Afiliaciones / Contributions & Affiliations 264 171 94 55% 84 79 5 7% 1.684 1.241 443 36% 283 304 -21 -7% 23 43 -19 -45% 6 7 (1) -15% Asambleas y Simposios / Assemblies & Symposiums 45 7 39 564% Gastos Legales / Legal Expenses 10 3 7 202% Adecuacion e Instalacion / Reconditioning & Instalation 10 3 7 249% 130 163 -33 -20% Servicios IT / IT Services Seguros / Insurances Servicios y Mantenimiento / Services & Manteinance Divulgacion y Publicidad / Marketing Relaciones publicas / Public Relations Utiles, Papeleria y Fotocopias / Stationery & Fotocopies Gastos de Viaje / Travel Expenses Depreciaciones / Depreciations 605 466 140 30% Amortizaciones / Amortizations 240 262 -22 -8% 89 46 43 93% - - - N/A 720 110 610 554% Método de Participación / Equity Method 1.450 0 1.450 N/A Utilidad o pérdida antes de impuestos / Profit before taxes 9.483 13.917 -4.434 -32% Impuesto de Renta y Complementarios y CREE / Income taxes 3.506 5.222 -1.716 -33% Utilidad o pérdida neta del ejercicio / Net profit for the period 5.977 8.695 -2.718 -31% Diversos / Sundries Deterioro de Cartera / Gastos Actividades No Ordinarios / Other Non Ordinary Expenses BOLSA DE VALORES DE COLOMBIA S.A. BALANCE INDIVIDUAL / STAND ALONE BALANCE SHEET IFRS A 31 de Marzo de 2016 / As of March 31, 2016 (Cifras en millones de pesos colombianos) / (Amounts stated in millions of Colombian pesos) CONCEPTO / CONCEPT mar-16 VAR mar-15 $ % ACTIVOS / ASSETS Activo corriente / Current assets Efectivo y Equivalentes al Efectivo / Cash and Cash Equivalents 14.208 24.412 -10.205 -42% Otros Activos Financieros Corrientes / Other current financial assets 17.960 37.219 -19.259 -52% 6.143 8.300 (2.157) -26% 13.749 10.050 3.699 37% 8.697 7.413 1.284 17% 60.756 87.393 -26.637 -30% 204 7 197 N/A Otros Activos no Financieros no Corrientes / Other Non-Current Non-Financial Assets 1.577 1.558 19 1% Inversiones bajo Método de Participación / Investments Held under Equity Method 26.273 27.278 -1.005 -4% Inversiones en Subsidiarias y Negocios Conjuntos / Investment in Subsidiaries and Associate Businesses 32.858 1.847 31.011 1679% 6.112 3.956 2.156 54% 19.277 19.073 204 1% 1.574 870 704 81% 87.875 54.590 33.285 61% 148.631 141.982 6.649 5% Transacciones entre partes relacionadas / Related Parties Deudores Comerciales y otras Cuentas por Cobrar / Trade Debtors and Other Accounts Receivable Activos por Impuestos Corrientes / Current Tax Assets Total Activo Corriente / Total Current Assets Activo no Corriente / Non-Current Assets Otros Activos Financieros no Corrientes / Other Non-current Financial Assets Activos intangibles distintos del Goodwill / Other Intangible Assets Propiedades y Equipo / Property and Equipment Activos por Impuestos Diferidos / Deferred tax assets Total Activo no Corriente / Total Non-Current Assets TOTAL ACTIVOS / TOTAL ASSETS CONCEPTO / CONCEPT mar-16 VAR mar-15 $ % PASIVOS / LIABILITIES Pasivo Corriente / Current liabilities Otros Pasivos Financieros Corrientes / Other Current Financial Liabilities - 87 -87 -100% Beneficios a Empleados / Employee Benefits 1.565 1.635 -70 -4% Acreedores Comerciales y Otras Cuentas por Pagar / Trade Creditors and Other Accounts Payable 6.489 2.607 3.882 149% Transacciones entre Partes Relacionadas / Related Parties 16.702 16.621 81 0% Impuesto de Renta y Complementarios y CREE / Income Taxes and CREE 10.632 14.407 -3.775 -26% 4.041 - 4.041 N/A 61 2.272 -2.211 -97% 6.185 6.165 20 0% 45.674 43.794 1.881 4% 597 611 -14 -2% Impuestos Diferidos no Corrientes / Non-Current Deferred Taxes 3.875 3.816 59 2% Total Pasivo no Corriente / Total Non-current Liabilities 4.472 4.427 45 1% 50.146 48.221 1.926 4% Capital Suscrito y Pagado / Subscribed and Paid-in Capital 18.673 18.673 - 0% Superávit de Capital / Capital Surplus 21.096 21.096 - 0% Reservas / Reserves 41.401 34.722 6.679 19% Resultados del Ejercicio / Results for the Period 5.977 8.695 (2.718) -31% Resultados de Ejercicios Anteriores / Results from Prior Period 3.414 3.414 - 0% Otros Resultados Integrales - ORI / Other Comprehensive Income - OCI 7.924 7.162 762 11% 98.485 93.762 4.723 5% - - - N/A 98.485 93.762 4.723 5% Pasivos Estimados y Provisiones / Estimated Liabilities and Provisions Pasivos por Impuestos Corrientes / Current Tax Liabilities Ingresos Recibidos por Anticipado Total Pasivo Corriente / Total Current Liabilities Pasivo no corriente / Non-Current Liabilities Beneficios a Empleados / Employee Benefits TOTAL PASIVOS / TOTAL LIABILITIES PATRIMONIO / STOCKHOLDERS’ EQUITY Total Patrimonio Atribuible a los Propietarios de la Matriz / Total Equity Attributable to Parent Company Owners Participación no Controlada / Non-Controlling Interest TOTAL PATRIMONIO / TOTAL STOCKHOLDERS’ EQUITY Cláusula de Exención de Responsabilidad: Los estados financieros contenidos en este documento comprenden el periodo allí descrito y son meramente para uso informativo. La información financiera es equivalente a la transmitida para dicho periodo a la Superintendencia Financiera de Colombia. La BVC no es responsable por el uso que terceros le den a la información aquí contenida. Los Estados Financieros más recientes aprobados por el Consejo Directivo de la BVC corresponden a los publicados con corte a [IV] trimestre de 2015. Disclaimer: The financial statements contained in this document are for the period herein described and are provided for informational purposes. The financial information is equivalent to the transmitted for that period to the Superintendence of Finance. The BVC is not liable for the use that third parties give to the information contained herein. The most recent financial statements approved by the Board of the BVC are those published for the [IV] quarter of 2015
![GUIA Ingles Contable[1]](http://s2.studylib.es/store/data/004394660_1-70043339287f9cf3ff9a02cde627e9ed-300x300.png)
