SOLUCIÓN DE LA PRIMERA PRÁCTICA
Anuncio
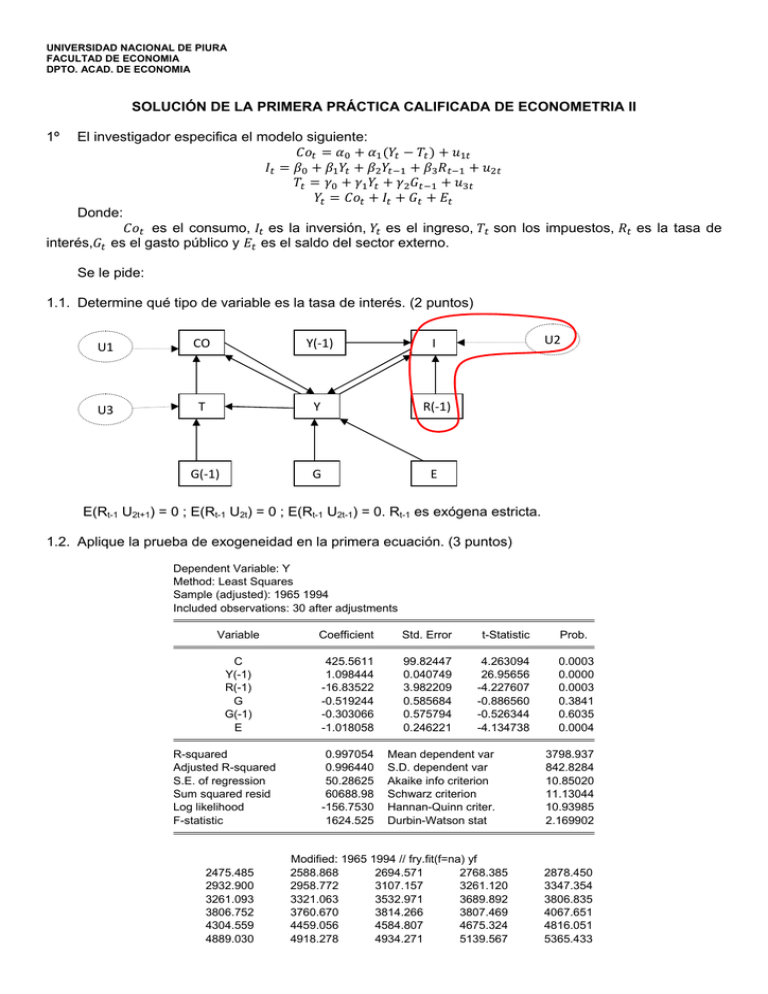
UNIVERSIDAD NACIONAL DE PIURA FACULTAD DE ECONOMIA DPTO. ACAD. DE ECONOMIA SOLUCIÓN DE LA PRIMERA PRÁCTICA CALIFICADA DE ECONOMETRIA II 1º El investigador especifica el modelo siguiente: Donde: es el consumo, es la inversión, es el ingreso, son los impuestos, es la tasa de interés, es el gasto público y es el saldo del sector externo. Se le pide: 1.1. Determine qué tipo de variable es la tasa de interés. (2 puntos) U1 CO Y(-1) I U3 T Y R(-1) G(-1) G E U2 E(Rt-1 U2t+1) = 0 ; E(Rt-1 U2t) = 0 ; E(Rt-1 U2t-1) = 0. Rt-1 es exógena estricta. 1.2. Aplique la prueba de exogeneidad en la primera ecuación. (3 puntos) Dependent Variable: Y Method: Least Squares Sample (adjusted): 1965 1994 Included observations: 30 after adjustments Variable Coefficient Std. Error t-Statistic Prob. C Y(-1) R(-1) G G(-1) E 425.5611 1.098444 -16.83522 -0.519244 -0.303066 -1.018058 99.82447 0.040749 3.982209 0.585684 0.575794 0.246221 4.263094 26.95656 -4.227607 -0.886560 -0.526344 -4.134738 0.0003 0.0000 0.0003 0.3841 0.6035 0.0004 R-squared Adjusted R-squared S.E. of regression Sum squared resid Log likelihood F-statistic 2475.485 2932.900 3261.093 3806.752 4304.559 4889.030 0.997054 0.996440 50.28625 60688.98 -156.7530 1624.525 Mean dependent var S.D. dependent var Akaike info criterion Schwarz criterion Hannan-Quinn criter. Durbin-Watson stat Modified: 1965 1994 // fry.fit(f=na) yf 2588.868 2694.571 2768.385 2958.772 3107.157 3261.120 3321.063 3532.971 3689.892 3760.670 3814.266 3807.469 4459.056 4584.807 4675.324 4918.278 4934.271 5139.567 3798.937 842.8284 10.85020 11.13044 10.93985 2.169902 2878.450 3347.354 3806.835 4067.651 4816.051 5365.433 2 Dependent Variable: T Method: Least Squares Sample (adjusted): 1965 1994 Included observations: 30 after adjustments Variable Coefficient Std. Error t-Statistic Prob. C Y(-1) R(-1) G G(-1) E 249.2049 0.214324 -19.67199 0.837760 -0.599792 0.236964 66.75673 0.027250 2.663067 0.391671 0.385057 0.164658 3.733030 7.864996 -7.386966 2.138938 -1.557670 1.439127 0.0010 0.0000 0.0000 0.0428 0.1324 0.1630 R-squared Adjusted R-squared S.E. of regression Sum squared resid Log likelihood F-statistic 816.8166 851.3299 920.0008 1032.092 1125.481 1338.870 0.976622 0.971751 33.62849 27141.00 -144.6822 200.5171 Mean dependent var S.D. dependent var Akaike info criterion Schwarz criterion Hannan-Quinn criter. Durbin-Watson stat 1071.933 200.0810 10.04548 10.32572 10.13513 1.274837 Modified: 1964 1994 // frt.fit(f=na) tf 869.6623 881.3520 890.2657 849.8148 924.5646 962.0452 968.1607 1023.128 1057.871 997.0926 959.1675 997.0486 1200.890 1259.003 1277.024 1369.254 1388.381 1441.125 882.1629 951.1265 1054.670 1079.041 1317.742 1472.817 Dependent Variable: CO Method: Least Squares Sample (adjusted): 1965 1994 Included observations: 30 after adjustments Variable Coefficient Std. Error t-Statistic Prob. C Y-T YF TF -256.4413 0.758394 0.062524 0.401378 25.11663 0.086716 0.088974 0.121268 -10.21002 8.745724 0.702720 3.309839 0.0000 0.0000 0.4885 0.0027 R-squared Adjusted R-squared S.E. of regression Sum squared resid Log likelihood F-statistic Prob(F-statistic) 0.998964 0.998845 21.19955 11684.94 -132.0410 8359.793 0.000000 Mean dependent var S.D. dependent var Akaike info criterion Schwarz criterion Hannan-Quinn criter. Durbin-Watson stat 2479.477 623.7507 9.069403 9.256229 9.129170 1.448321 Wald Test: Equation: MECO Test Statistic F-statistic Chi-square Value 27.58209 55.16419 Normalized Restriction (= 0) C(3) C(4) df Probability (2, 26) 2 0.0000 0.0000 Value Std. Err. 0.062524 0.401378 0.088974 0.121268 3 1.3. Verifique que la tributación es exógena fuerte. (3 puntos) Para que la tributación sea exógena fuerte requiere que sea exógena débil y en el diagrama de causalidad se observa que: 1 0. 1.4. Estimar la segunda ecuación por mínimos cuadrados bietápicos y verifique si los residuos están incorrelacionados. (5 puntos) Dependent Variable: I Method: Two-Stage Least Squares Sample (adjusted): 1965 1994 Included observations: 30 after adjustments Instrument list: C Y(-1) R(-1) G G(-1) E Variable Coefficient Std. Error t-Statistic Prob. C Y Y(-1) R(-1) -83.88072 1.020319 -0.875731 8.538088 50.79124 0.189192 0.192794 4.398341 -1.651480 5.393030 -4.542310 1.941207 0.1107 0.0000 0.0001 0.0631 R-squared Adjusted R-squared S.E. of regression F-statistic Prob(F-statistic) 0.915613 0.905876 44.11044 98.56754 0.000000 Mean dependent var S.D. dependent var Sum squared resid Durbin-Watson stat Second-Stage SSR 615.9400 143.7774 50589.00 1.694238 24128.56 T=30; k=3 entonces dl=1.2138 y du=1.6498, Como DW=1.69438 se acepta la hipótesis nula, es decir, no existe autocorrelación de primer orden. Sample: 1965 1994 Included observations: 30 Autocorrelation . |* . | .**| . | Partial Correlation AC . |* . | .**| . | PAC 1 0.120 0.120 2 -0.286 -0.305 Q-Stat 0.4797 3.2829 Prob 0.489 0.194 No existe autocorrelación de primer orden (0.4797 < 3.84) y de segundo orden (3.2829 < 5.99). Breusch-Godfrey Serial Correlation LM Test: Obs*R-squared 0.667873 Prob. Chi-Square(1) 0.4138 Test Equation: Dependent Variable: RESID Method: Two-Stage Least Squares Sample: 1965 1994 Included observations: 30 Presample missing value lagged residuals set to zero. Variable Coefficient Std. Error t-Statistic Prob. C Y Y(-1) R(-1) RESID(-1) -9.835846 0.068758 -0.068231 0.184122 0.184943 52.85041 0.211429 0.214416 4.441945 0.245128 -0.186107 0.325207 -0.318218 0.041451 0.754476 0.8539 0.7477 0.7530 0.9673 0.4576 R-squared Adjusted R-squared S.E. of regression 0.022262 -0.134176 44.48045 Mean dependent var S.D. dependent var Akaike info criterion -1.74E-13 41.76659 10.57899 4 Sum squared resid Log likelihood F-statistic Prob(F-statistic) 49462.76 -153.6848 0.142308 0.964728 Schwarz criterion Hannan-Quinn criter. Durbin-Watson stat 10.81252 10.65370 1.928518 Como se tiene muestra pequeña se utiliza Harvey, tenemos LMC=(30-5)*0.022262/(1-0.022262)= 0.569222021 y se compara con F(1,25)=4.2417; por lo tanto, se acepta la hipótesis nula,es decir, ausencia de autocorrelación de primer orden. Breusch-Godfrey Serial Correlation LM Test: Obs*R-squared 3.597255 Prob. Chi-Square(2) 0.1655 Test Equation: Dependent Variable: RESID Method: Two-Stage Least Squares Sample: 1965 1994 Included observations: 30 Presample missing value lagged residuals set to zero. Variable Coefficient Std. Error t-Statistic Prob. C Y Y(-1) R(-1) RESID(-1) RESID(-2) 16.09590 -0.065247 0.063778 -0.609564 0.131701 -0.363908 53.58647 0.220586 0.222826 4.328619 0.239593 0.223009 0.300372 -0.295788 0.286224 -0.140822 0.549684 -1.631808 0.7665 0.7699 0.7772 0.8892 0.5876 0.1158 R-squared Adjusted R-squared S.E. of regression Sum squared resid Log likelihood F-statistic 0.119909 -0.063444 43.07114 44522.95 -152.1066 0.653978 Mean dependent var S.D. dependent var Akaike info criterion Schwarz criterion Hannan-Quinn criter. Durbin-Watson stat -1.74E-13 41.76659 10.54044 10.82068 10.63009 2.054917 Tenemos LMC=(30-6)*0.119909/(2*(1-0.119909))= 1.634953658 y se compara con F(2,24)=3.40283; por lo tanto, se acepta la hipótesis nula, es decir ausencia de autocorrelación de segundo orden. 1.5. Determine el método adecuado de estimación. (2 puntos) Las tres ecuaciones de comportamiento (Co, I, T) están sobreidentificadas entonces se estiman por mínimos cuadrados bietápicos o trietápicos. Dependent Variable: CO Method: Two-Stage Least Squares Sample (adjusted): 1965 1994 Included observations: 30 after adjustments Instrument list: C Y(-1) R(-1) G G(-1) E Variable Coefficient Std. Error t-Statistic Prob. C Y-T -125.2456 0.955159 28.84147 0.010296 -4.342552 92.76630 0.0002 0.0000 R-squared Adjusted R-squared F-statistic Prob(F-statistic) 0.996766 0.996651 8605.587 0.000000 Mean dependent var S.D. dependent var Durbin-Watson stat Second-Stage SSR Dependent Variable: T Method: Two-Stage Least Squares Sample (adjusted): 1965 1994 Included observations: 30 after adjustments Instrument list: C Y(-1) R(-1) G G(-1) E 2479.477 623.7507 0.620662 68549.32 5 Variable Coefficient Std. Error t-Statistic Prob. C Y G(-1) 71.51003 0.154729 0.559216 76.20034 0.036028 0.259124 0.938448 4.294652 2.158105 0.3563 0.0002 0.0400 R-squared Adjusted R-squared F-statistic Prob(F-statistic) 0.936240 0.931517 197.7034 0.000000 Mean dependent var S.D. dependent var Durbin-Watson stat Second-Stage SSR 1071.933 200.0810 0.748794 76911.29 La correlación entre la perturbación del consumo y de la tributación es significativa, por lo tanto el método adecuado es mínimos cuadrados en tres etapas. Covariance Analysis: Ordinary Sample (adjusted): 1965 1994 Included observations: 30 after adjustments Correlation t-Statistic Probability RESCO 2º RESCO 1.000000 --------- RESI RESI -0.097186 -0.516704 0.6094 1.000000 --------- REST 0.717036 5.443326 0.0000 0.223410 1.212828 0.2353 REST 1.000000 --------- Comente y fundamente su respuesta. (5 puntos) 2.1. Es importante verificar la constancia de la matriz de covarianza entre las perturbaciones de distintas ecuaciones porque si no se cumple entonces los métodos de estimación no son válidos. 2.2. La causalidad Granger se aplica a variables exógenas.
